By Whom? For Who?
Supervisors:
Prof. Dr. Bernd Fröhlich
Dr. Patrick Riehmann
M. Sc. Dora Kiesel
M. Sc. Gareth Rendle
Study programs:
| Degree | Study Programme | Examination Regulations | ECTS |
|---|---|---|---|
| B.Sc. | Informatik | all | 15 |
| B.Sc. | Medieninformatik | all | 15 |
| M.Sc. | Computer Science for Digital Media | PV18 and lower | 15 |
| M.Sc. | Computer Science for Digital Media | PV20 | 12 |
| M.Sc. | Computer Science and Media | all | 15 |
| M.Sc. | Human-Computer Interaction | PV17 and lower | 15 |
| M.Sc. | Human-Computer Interaction | PV19 | 12/18 |
Description
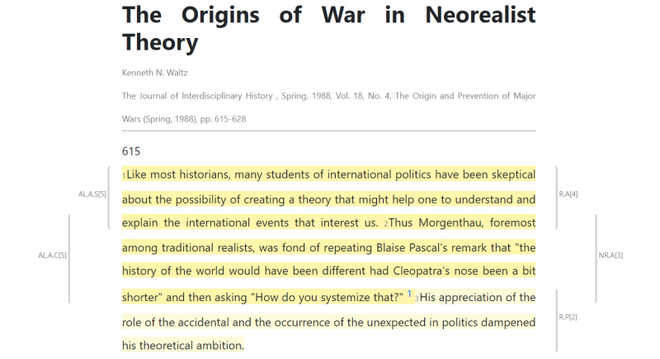
In this project, we are going to visualize and analyze ongoing text annotation processes conducted with students of the political sciences. Students will perform annotations during annotation scheme development and in a seminar at the European University Viadrina Frankfurt (Oder).
Who?
Instructors and participants of the seminar at the European University Viadrina will use the developed system to analyze their manual annotation process and squeeze the most out of the given texts.
What?
Starting from annotation data gathered already during annotation scheme development, we will design and implement new visualizations that aid in analyzing the annotations: their associated text and position, layers, categories, and relations as well as the annotators’ uncertainty.
Why?
The ultimate goal of the project would be:
- to support the supervisors of the annotation process in keeping track of the annotators’ results by visually encoding typical measures like inter-annotator reliability or Cohen’s Kappa
- to enhance the communication between supervisors and annotators about the general results, common mistakes and misconceptions, and best practices to improve the discourse quality overall
- to gain insights about the (temporal) meta-information captured during the annotation process itself in order to derive conclusions about working patterns and how they may be related to annotation quality
How?
The derived visualization designs will use Python for data preparation and database access. The visual encoding and interface will be implemented in Javascript which allows the smooth integration into an existing web application.

Requirements
- Solid programming skills in Javascript und Python
- Successful completion of the visualization lecture
Assessment
- Productive participation in project meetings
- your part in the implementation of data flow and visualizations
- mid-term & final presentations
Literature
If you want to prepare yourself for the project or are generally interested in the topic, feel free to have a look at the base literature.
Visualization:
Munzner, Tamara. ”Visualization analysis and design”. CRC press, 2014.
Jänicke, Stefan, et al. "On Close and Distant Reading in Digital Humanities: A Survey and Future Challenges." EuroVis (STARs). 2015.
Guo, Yi, et al. "A survey on visual analysis of event sequence data." IEEE Transactions on Visualization and Computer Graphics (2021).
Political sciences:
Waltz, Kenneth N. "The Origins of War in Neorealist History." The Origin and Prevention of Major Wars (1988).
Waltz, Kenneth N. "The emerging structure of international politics." International security 18.2 (1993): 44-79.
