No edit summary |
|||
| Line 1: | Line 1: | ||
== '''FINAL PROJECT''': pulse — distorting live images == | == '''FINAL PROJECT''': pulse — distorting live images == | ||
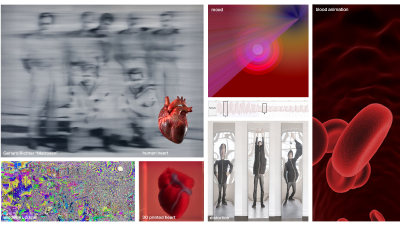
'''27.05.2021''' moodboard / waiting for sensor to arrive | |||
[[File:260521_moodboard.png|400px]] | |||
more links | |||
* heart, national geographic [https://www.youtube.com/watch?v=GMBSU-2GK3E&list=PLvpdUWhGx43-OttXG4lp11-UohI3wPeqV&index=13] | |||
* human heart [https://www.youtube.com/watch?v=ebzbKa32kuk&list=PLvpdUWhGx43-OttXG4lp11-UohI3wPeqV&index=16] | |||
* heart beat Arduino processing [https://www.youtube.com/watch?v=2_c0yE9QHNI&list=PLvpdUWhGx43-OttXG4lp11-UohI3wPeqV&index=14&t=319s] | |||
---- | |||
'''20.05.2021''' A normal pulse is regular in rhythm and strength. Sometimes it's higher, sometimes lower, depending on the situation and health condition.You rarely see it and feel it from time to time. Apart from the visualisation of an EKG, what could it look like? How can this vital rhythm be visualised? | '''20.05.2021''' A normal pulse is regular in rhythm and strength. Sometimes it's higher, sometimes lower, depending on the situation and health condition.You rarely see it and feel it from time to time. Apart from the visualisation of an EKG, what could it look like? How can this vital rhythm be visualised? | ||
| Line 15: | Line 26: | ||
* webcam interaction [https://www.youtube.com/watch?v=j0mMU5Pu5EE&list=PLvpdUWhGx43-OttXG4lp11-UohI3wPeqV&index=4 ] | * webcam interaction [https://www.youtube.com/watch?v=j0mMU5Pu5EE&list=PLvpdUWhGx43-OttXG4lp11-UohI3wPeqV&index=4 ] | ||
* distorting images [https://www.youtube.com/watch?v=Rgcvnm-lcF8&list=PLvpdUWhGx43-OttXG4lp11-UohI3wPeqV&index=10&t=101s] | * distorting images [https://www.youtube.com/watch?v=Rgcvnm-lcF8&list=PLvpdUWhGx43-OttXG4lp11-UohI3wPeqV&index=10&t=101s] | ||
---- | ---- | ||
Revision as of 21:35, 26 May 2021
FINAL PROJECT: pulse — distorting live images
27.05.2021 moodboard / waiting for sensor to arrive
more links
20.05.2021 A normal pulse is regular in rhythm and strength. Sometimes it's higher, sometimes lower, depending on the situation and health condition.You rarely see it and feel it from time to time. Apart from the visualisation of an EKG, what could it look like? How can this vital rhythm be visualised?
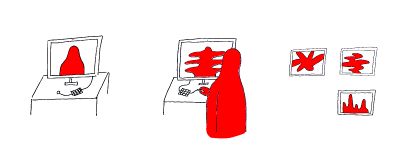
I would like to use an Arduino pulse sensor to create an interactive installation. The setup contains the pulse sensor and a screen. The user can easily connect to the Max by clipping the Arduino sensor to its finger. The webcam is connected and the screen shows a pulsating and distorted image of the participant. The pulse sensor visually stretches the webcam image, moves in rhythm of the pulse and creates a new result.
A more complex version would be the interaction of two pulses. Two Arduino pulse sensors are connected to MAX and one distorted webcam image is showing the combination of the pulses from two people. This idea could be further developed during the semester.
How does it work: Arduino pulse sensor that measures the pulse with the fingers. Usually, this is used to measure the radial pulse. In MAX, a patch must be created in which the data from Arduino is converted into parameters which distorts the image.
some links:
PROJECT THOUGHTS
Please take a look at Johannes Schneemann Project idea 1
This is a short summary of my thoughts. But I would like to develop further my final project idea.
What does the space we share online look like?
Participants in an online meeting share a virtual space without having the same circumstances. What circumstances influence a meeting in reality? Someone might be cold or hot, very noisy, the washing machine is running in the background, late at night or early in the morning with a time shift...
The shared virtual space should be represented by its own added member of the BBB conference displaying an interactive moving image. It is generated from data collected from all participants at the time of the meeting. For 5 participants, the parameters are: body temperature, room temperature, pulse, time, noise. This non-visual data is translated into visual images. The room we are sharing online gets another dimension.
I have to admit that it won’t be technically feasible in this short time (real time data exchange, embed in BBB, interactive visualisation)
Homework 3
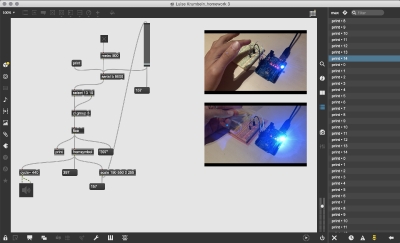
Sensing physical parameters File:Luise Krumbein_homework 3.maxpat
Video: https://www.youtube.com/watch?v=5iw1E1od4O8
Homework 2
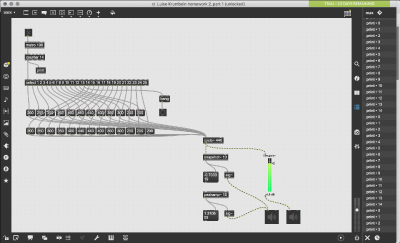
1. Sound to number File:Luise Krumbein homework 2_part 1.maxpat
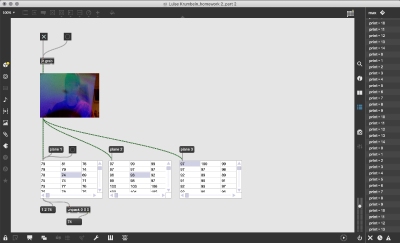
2. Video analysis File:Luise Krumbein_homework 2_part 2.maxpat
Homework 1
First patch File:210422_Luise Krumbein.maxpat
Projects from other students: F.Z. Aygüler [6] Wei Ru Tai [7]
