No edit summary |
No edit summary |
||
| Line 12: | Line 12: | ||
[[File:Data_spatializer_01.png|left|thumbnail|500px]] | [[File:Data_spatializer_01.png|left|thumbnail|500px]] | ||
== Related Work == | |||
[http://hint.fm/wind/ visualization of the current wind in the USA] | |||
Revision as of 11:00, 4 November 2013
Idea
My first thoughts on creating an interactive visualization of the German law system have been doomed to fail: the government sold the digital information about the development of law and the verdicts interpreting it to private companies. The only possibility to study this data is by reading it by hand.
Therefore I changed my plan. Instead of taking a big topic and creating a big data object out of it, I am thinking about creating a couple of smaller interactive sketches to different topics dealing with complexity and self organization. Possible topics: wind & weather data, oceanic data, astronomical data, data about human behavior (garbage, carbon-dioxide etc.).
As a final result i would like to have a room with some displays showing those animated sketches together with an object spatializing this data.
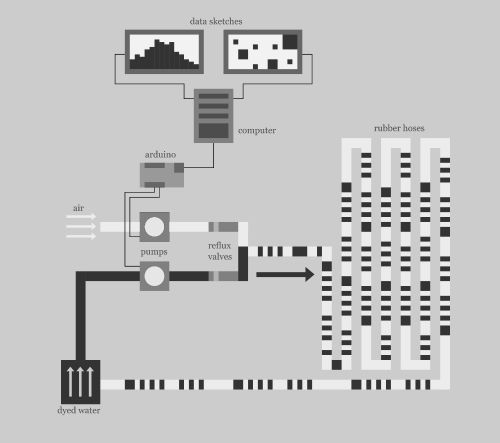
For the spatializing I thought about an object which translates a one-dimensional data stream into a complex three-dimensional structure.
My first attempt for this would be the following:
