No edit summary |
|||
| Line 14: | Line 14: | ||
1. [http://codepen.io/ppapadi/pen/QGdqKb?editors=0010 Random distribution matrix] <br> | 1. [http://codepen.io/ppapadi/pen/QGdqKb?editors=0010 Random distribution matrix] <br> | ||
This centralized ray matrix is a visualisation of random distribution of interconnected points. <br> | This centralized ray matrix is a visualisation of a random distribution of interconnected points. <br> | ||
[[Image:ppapadi_03a.jpg|thumb|left|200px]] <br> | [[Image:ppapadi_03a.jpg|thumb|left|200px]] <br> | ||
<br style="clear:both;"> | <br style="clear:both;"> | ||
Revision as of 01:14, 27 February 2017
Week 01
Course application project
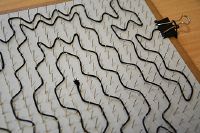
The drawing instructions are sketched out here:
The result is here:
Week 03
1. Random distribution matrix
This centralized ray matrix is a visualisation of a random distribution of interconnected points.
2. Curve controlled by randomness
3. Curve controlled by randomness - bonus
Week 04
1. Generative turtle walk
This turtlewalk follows a set of commands and repeats itself at a different angle when the turtle restarts. The red dots are the turning points of the route, but displaced.
2. turtle walk with data
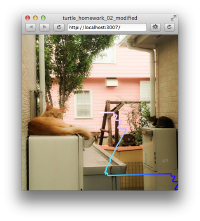
The selected background image is converted to the command which defines the direction of turtle walk.
Each pixels of the image are sampled, and the strongest one of the R, G or B is assigned as a command.
Thus, the direction of the curve reflects the dominant color factor
To test locally, you can download this project;
Media:Turtle_homework_02_modified.zip


