GMU:Speculative Atmospheres II/Sophia Amelia Eickhoff: Difference between revisions
mNo edit summary |
mNo edit summary |
||
| (126 intermediate revisions by the same user not shown) | |||
| Line 1: | Line 1: | ||
''' | '''MAPPING OF THE INVISIBLE ENVIORMENT''' | ||
''Idea'' | '''Idea''' | ||
For my project I want to collect the invisible elements (data) that shape the natural atmosphere on my walks and visualize them artistically. | For my project I want to collect the invisible elements (data) that shape the natural atmosphere on my walks and visualize them artistically. An alternative map is created, which is not used for orientation. It is a reproduction of brief moments that will most likely not come up again in this way. | ||
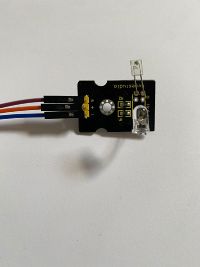
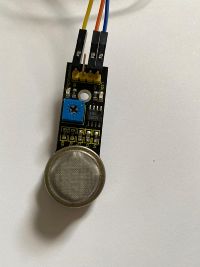
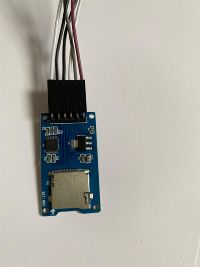
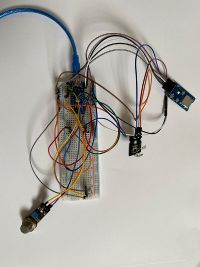
On the route, light, air quality, temperature and pulse are measured every minute using an Arduino and sensors. These are stored via an SD card and read out with a code. | |||
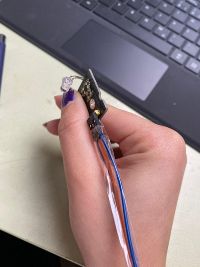
On the route, light, air quality, temperature and the walkers pulse are measured every minute using an Arduino and sensors. These are stored via an SD card and read out with a code. | |||
The time and route are stored using a tracking app.The data determines the parameters of the subsequent image design. | The time and route are stored using a tracking app.The data determines the parameters of the subsequent image design. | ||
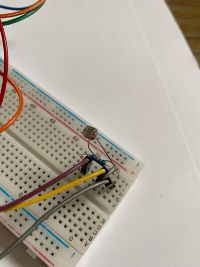
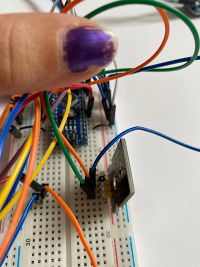
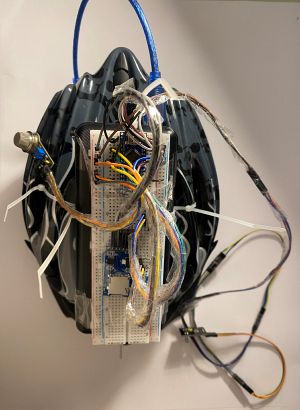
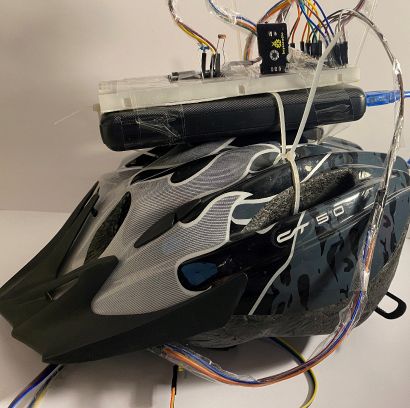
For transport, a "rack" is built that attaches the breadboard to the body. | For transport, a "rack" is built that attaches the breadboard to the body. | ||
After each walk the collected | After each walk the collected data will be transscripted and painted with onto a map that shows the walked area. In order to associate the data to the correct point of the line the pace througout the walk has to be steady. | ||
*Time/Duration= Size of the canvas | *Time/Duration= Size of the canvas | ||
*Route= Shape of the line | *Route= Shape of the line | ||
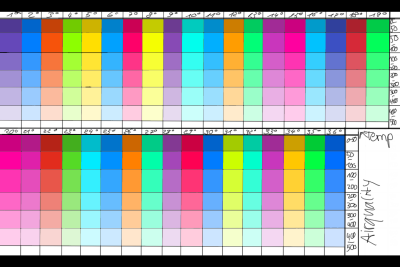
*Temperature= Color | *Temperature= Color of the line | ||
* | *Air quality= Saturation of the color | ||
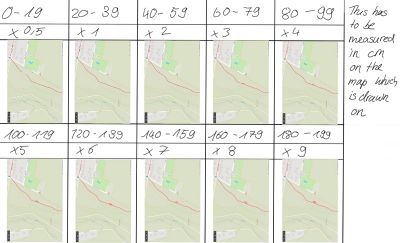
* | *Pulse= Thickness of the line | ||
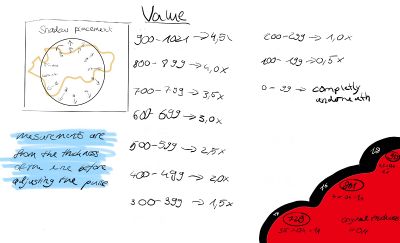
* | *Light= Shadow of the line | ||
*Time of the day= Shift direction of shadow | |||
'''Progress/Work''' | |||
''Code'' | |||
#include <SPI.h> //including SDcard | |||
#include <SD.h> | |||
#include <math.h> //including for temperature calculation | |||
File myFile; //directing data to file | |||
void setup() { | |||
Serial.begin(9600); //starting comunication with arduino | |||
while (!Serial) { | |||
; | |||
} | |||
Serial.print("Initializing SD card..."); //initializing the SD card | |||
if (!SD.begin(10)) { | |||
Serial.println("initialization failed!"); // signal if connection failed | |||
while (1); | |||
} | |||
Serial.println("initialization done."); // signal if connection succeded | |||
myFile = SD.open("Spaziergang.txt", FILE_WRITE); //naming file | |||
if (myFile) { | |||
Serial.print("Writing to Spaziergang.txt..."); | |||
myFile.println ("Spaziergang"); //naming the section of the file, date, place, number of walk | |||
myFile.close(); | |||
Serial.println("done."); | |||
' | } | ||
else { | |||
// if the file didn't open, print an error: | |||
Serial.println("error opening Spaziergang.txt"); //signal if opening failed | |||
} | |||
} | |||
void loop() { | |||
//if the communication started successfully- | |||
myFile = SD.open("Spaziergang.txt", FILE_WRITE); | |||
if (myFile) { | |||
//collect incoming data from sensors | |||
//light | |||
Serial.print("Writing to Spaziergang.txt..."); | |||
int light = analogRead(A0); | |||
myFile.print( "Licht: "); | |||
Serial.print("Writing to | |||
int light = analogRead(A0); | |||
myFile.println(light); | myFile.println(light); | ||
//temperature | |||
//temperature | |||
myFile.print ("Temperatur: "); | myFile.print ("Temperatur: "); | ||
double temp=analogRead(A1); | double temp=analogRead(A1); | ||
| Line 73: | Line 79: | ||
double r=(5-fenya)/fenya*4700; | double r=(5-fenya)/fenya*4700; | ||
myFile.println( 1/( log(r/10000) /3950 + 1/(25+273.15))-273.15); | myFile.println( 1/( log(r/10000) /3950 + 1/(25+273.15))-273.15); | ||
// airquality | // airquality | ||
int gas = analogRead(A3); | int gas = analogRead(A3); | ||
myFile.print( "Gas: "); | myFile.print( "Gas: "); | ||
myFile.println(gas, DEC); | myFile.println(gas, DEC); | ||
//pulse | |||
//pulse | |||
int pulse = analogRead(A2); | int pulse = analogRead(A2); | ||
myFile.print( "Pulse: "); | myFile.print( "Pulse: "); | ||
myFile.println(pulse); | myFile.println(pulse); | ||
delay(60000); //collect data every minute | |||
// close the file: | delay(60000); //collect data every minute | ||
// close the file: | |||
myFile.close(); | myFile.close(); | ||
Serial.println("Sensor.geschrieben."); | Serial.println("Sensor.geschrieben."); | ||
} | |||
} | |||
else { | else { | ||
// if the file didn't open, print an error: | // if the file didn't open, print an error: | ||
Serial.println("error opening | Serial.println("error opening Spaziergang.txt"); | ||
} | } | ||
} | } | ||
''Breadboard'' | ''Breadboard'' | ||
'' | [[File:PulseSensor.jpeg|200px]][[File:AirqualitySensor.jpeg|200px]][[File:LightSensor.jpeg|200px]][[File:TemperatureSensor.jpeg|200px]][[File:SdCardModule.jpeg|200px]][[File:BreadBoard.jpeg|200px]] | ||
[[File:PulsAttached.jpeg|200px]][[File:AdditionalEquipment.jpeg|200px]] | |||
''Rack / Helmet'' | |||
[[File:Foto 03.02.22, 17 51 37.jpg|300px]][[File:Foto 03.02.22, 17 55 28.jpg|410px]] | |||
''Data Arduino / SD-Card'' | |||
[[File:Screenshot (61).png|200px]] | |||
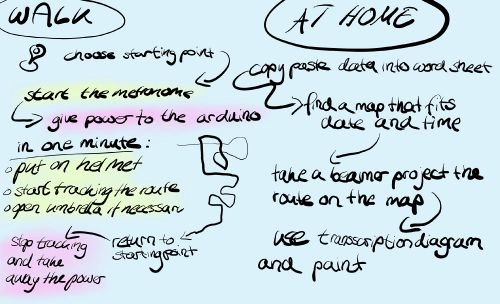
The first minute is not taken into account as the gas sensor needs about 30 seconds to be ready. In the meantime, the helmet is also put on and the route tracking is started. | |||
Delete collected data from SD-Card to seperate new from old. Copy-Paste into word sheet to make it easier to read and work with. | |||
''Data Phone'' | |||
In order to track the route the app "Runkeeper" is used. | |||
To keep a steady pace a recorded metronome on Spotify is beeing played via headphones. Additionally the data for the average step-length from the "Health-App" is taken into calculation. | |||
https://open.spotify.com/episode/23OEM2pZZi48sWNPpCKako?si=a112c55f61694699 | |||
[[File:Steplength.jpeg|200px]] | |||
'''Guide''' | |||
''Determinations'' | |||
*Never stop walking -j ust walk in a different direction | |||
*Always take 100 steps a minute and take care that they are the same length | |||
*Return to startingpoint | |||
*Don´t walk on Mondays - Corona Demonstrations | |||
*Don´t walk in storms | |||
*Remember that time determines size - maps are maybe not available | |||
''Sequence'' | |||
[[File:guidesheet1.jpg|500px]] | |||
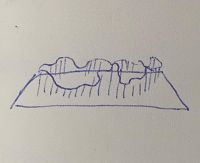
''Transscription Diagram'' | |||
[[File:Transscription Diagramm pulse 2.jpg|400px]] Color and Gas | |||
[[File:ColorTransscriptionDiagram.png|400px]] Pulse | |||
[[File:shadowtransscription.jpg|400px]] Shadow | |||
'''In Practice''' | |||
''Walking'' | |||
(At the end of the video I included a clip of two police officers beeing filmed for some kind of a TV-Show. Because of this I had to stop walking and restart at another place.) | |||
{{#ev:vimeo|674919770}} | |||
''At home'' | |||
[[File:SetupForTranslation.jpeg|300px]][[File:TranslationWork.jpeg|300px]][[File:coloradjusting.jpeg|300px]][[File:painttttt.jpeg|300px]] | |||
'''Visualition''' | |||
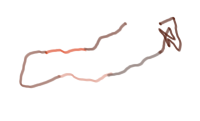
Walk 1 : Weimar City Center, 22.01.2022, 18:35, 36min, 3KM, 100 Steps a Minute | |||
[[File:Route1.jpeg|800px]] | |||
[[File:WalkOne.png|300px]] | |||
[[:File:Spaziergang 22.01.2022 Weimar Innenstadt.pdf]] | |||
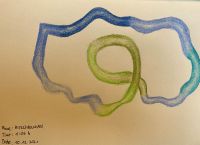
Walk 2 : Weimar Ilmpark, 25.01.2022, 14:48, 57min, 4,8KM, 100Steps a Minute | |||
[[File:Route2.jpeg|800px]] | |||
[[File:WalkTwo.png|300px]] | |||
[[:File:Spaziergang 25.01.2022 Weimar Ilmpark.pdf]] | |||
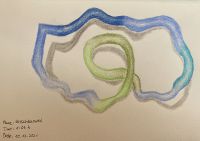
Walk 3 : Weimar West, 01.02.2022,12:12, 65min, 6KM, 100 Steps a Minute | |||
[[File:Route3.jpeg|800px]] | |||
[[File:WalkThree.png|300px]] | |||
[[:File:Spaziergang 01.02.2022 Weimar West.pdf]] | |||
Walk 4 : Weimar Kirschbachtal, 17:32, 33min, 2,83KM, 100 Steps a Minute | |||
[[File:Route4.jpeg|800px]] | |||
[[File:WalkFour.png|300px]] | |||
[[:File:PDF Spaziergang 02.02.2022 Weimar Kirschbachtal.pdf]] | |||
'''Reflecting''' | |||
What I had to realise again and again in the editing time is that I am not a computer. My eye cannot determine colour as accurately as a computer and my hand is too shaky to keep perfect control over the brush. I also had to keep recalculating everything to make sure it was right. I make a lot of mistakes in editing that can't be undone. | |||
I also had to stop many walks or couldn't make use of them because a connection didn't work properly, the weather didn't cooperate or instead of being able to continue, I suddenly found myself standing in someone's garden. | |||
The helmet has caused quite a stir in public. Because of the conspicuousness, I was often held up and could not go for a walk peacefully, which is an essential part of a walk. People also looked at me with uncertainty (sometimes even with disgust or fear) because they couldn't judge what exactly my mission was. That's why I avoided crowded or indoor spaces. | |||
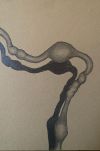
Also, for the type of visualisation (the route line), the input of data, i.e. the change of the line, is too much. 3 sensors would have been enough. The second line seems rather confusing. The effect that space is suggested by a "shadow" is missing. | |||
'''Future''' | |||
I will have to get out of my comfort zone and teach myself how to deal with new media. Overcoming this and learning anew will probably be exhausting at first, but the gain is worth it. It will cost me time at first, but in the long run, it will save me a lot of time. The creative possibilities are more varied and fit better when working with precise data. | |||
I would like to keep the concept of visualising my walks in the future. However, I would like to design the presentation digitally (Processing/Unity) and work with live data. Additionally, the background or surrounding space will be defined by sensor values, not only the route. | |||
Which sensors and which parameters I will use for the visualisation will remain flexible. | |||
I am at odds with myself as to whether I want to keep the anit-aesthetic of the helmet or create a more inconspicuous, unprovocative design. | |||
''Keywords'' | |||
'''Thoughts while working''' | |||
. ''Keywords/Inspiration'' | |||
*Determination-Indetermination | *Determination-Indetermination | ||
*History of Mapping | **Thoughts by Nam June Paik | ||
*What is the information shown in commercial maps and to what extent can they be political? | |||
*History of Mapping-Alternative/Artistic mapping | |||
**https://de.wikipedia.org/wiki/Kartografie | |||
**https://th.bing.com/th/id/OIP.B8hqhKchjCfEgoO9OZtZTQHaHa?pid=ImgDet&rs=1 | |||
**https://www.pinterest.de/pin/430586414367848528/ | |||
**https://mir-s3-cdn-cf.behance.net/project_modules/max_1200/17a04e56210215.59a5472bbe6f6.jpg | |||
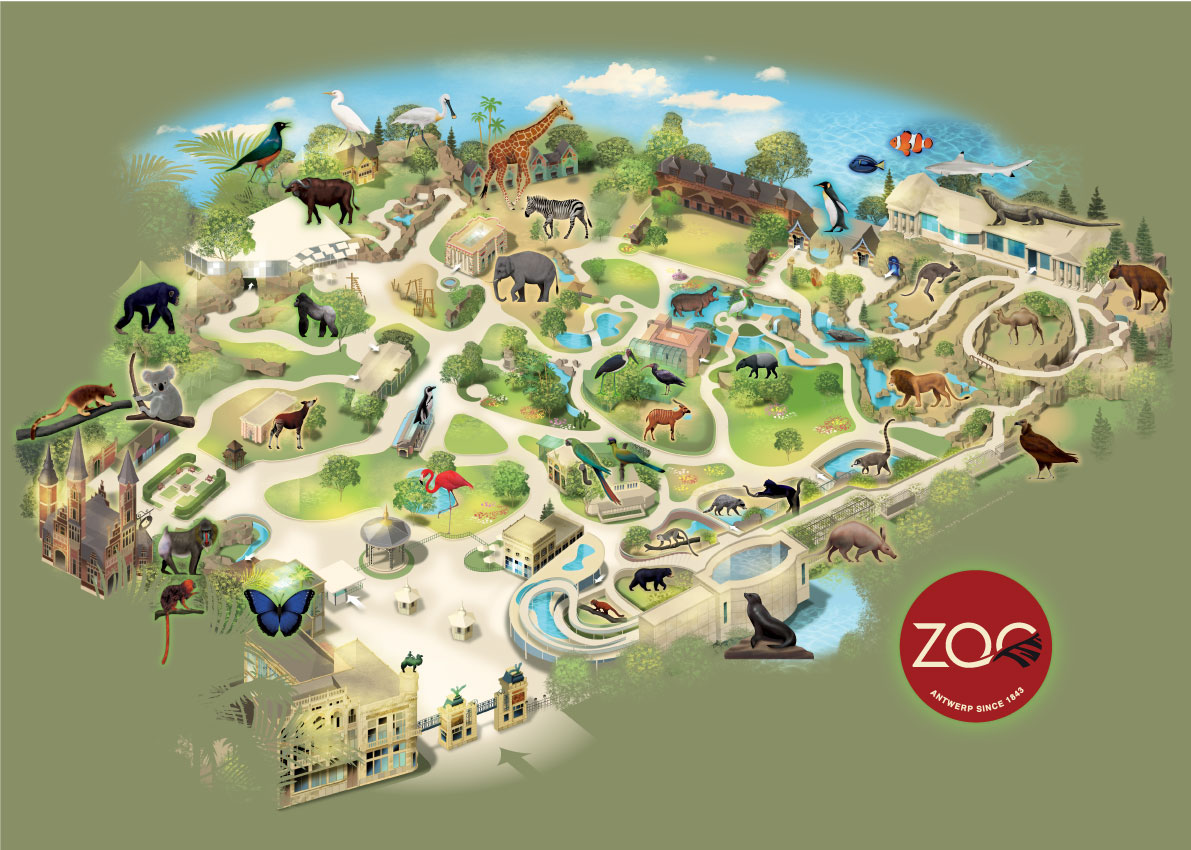
**https://www.zoochat.com/community/media/my-ideal-london-zoo-map-2018.415505/full?d=1537206722 | |||
*Strollology | *Strollology | ||
*Correlation of Data | **https://vimeo.com/96979458?embedded=true&source=video_title&owner=16179567 | ||
**http://www.spaziergangswissenschaft.de/ | |||
*Correlation -Interpretation of Data | |||
**https://lastminuteengineers.com/mq2-gas-senser-arduino-tutorial/ | |||
*Context/ Asssociation of Color | *Context/ Asssociation of Color | ||
*Work of Tobias Zimmer - Identical Walk | |||
**https://www.tobiaszimmer.net/projects/identical-walk.php | |||
''Sketches'' | |||
[[File:Linearroute.png|200px]] [[File:Anhang 1 (2).jpeg|200px]][[File:razm.jpeg|200px]][[File:rotgelbrauml.jpeg|200px]][[File:Hintergrund.png|200px]][[File:Sketcch.jpeg|200px]][[File:Sketccch.jpeg|200px]][[File:3dcollage.jpeg|200px]][[File:Route33.jpeg|100px]] | |||
'''discarded ideas''' | |||
*The place and the area of the walked route are indicated. Depending on what dominates the walk, a text (internal state) or a photo (external state) is attached. Also, an attempt is made to put this state in context with the collected data | |||
(I decided against it because the focus would be shifted away from visualising the data of the walk.) | |||
*Photo/Gerhard Richter for background | |||
**https://www.galerie-leidel.de/bild/fuji | |||
(I decided against it because i preferred to work with the association of maps.) | |||
*Humitdity Sensor | |||
(I decided against it because the data input would have been to much) | |||
*Distance Sensor | |||
(I decided against it because the distance to surroung objects would have probably not been visible. The pulse / thickness of the line would have coverd it) | |||
Latest revision as of 00:48, 9 February 2022
MAPPING OF THE INVISIBLE ENVIORMENT
Idea
For my project I want to collect the invisible elements (data) that shape the natural atmosphere on my walks and visualize them artistically. An alternative map is created, which is not used for orientation. It is a reproduction of brief moments that will most likely not come up again in this way.
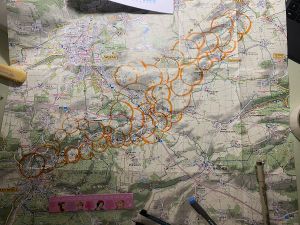
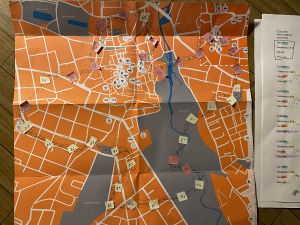
On the route, light, air quality, temperature and the walkers pulse are measured every minute using an Arduino and sensors. These are stored via an SD card and read out with a code. The time and route are stored using a tracking app.The data determines the parameters of the subsequent image design. For transport, a "rack" is built that attaches the breadboard to the body. After each walk the collected data will be transscripted and painted with onto a map that shows the walked area. In order to associate the data to the correct point of the line the pace througout the walk has to be steady.
- Time/Duration= Size of the canvas
- Route= Shape of the line
- Temperature= Color of the line
- Air quality= Saturation of the color
- Pulse= Thickness of the line
- Light= Shadow of the line
- Time of the day= Shift direction of shadow
Progress/Work
Code
 #include <SPI.h> //including SDcard
 #include <SD.h>
 #include <math.h> //including for temperature calculation
File myFile; //directing data to file
void setup() {
 Serial.begin(9600); //starting comunication with arduino
 while (!Serial) {
 ;
 }
 Serial.print("Initializing SD card..."); //initializing the SD card
 if (!SD.begin(10)) {
 Serial.println("initialization failed!"); // signal if connection failed
 while (1);
 }
 Serial.println("initialization done."); // signal if connection succeded
 myFile = SD.open("Spaziergang.txt", FILE_WRITE); //naming file

  if (myFile) {
 Serial.print("Writing to Spaziergang.txt...");
 myFile.println ("Spaziergang"); //naming the section of the file, date, place, number of walk
 myFile.close();
 Serial.println("done.");
 }
 else {
 // if the file didn't open, print an error:
  Serial.println("error opening Spaziergang.txt"); //signal if opening failed
   }
  }
 void loop() {

 //if the communication started successfully-
 myFile = SD.open("Spaziergang.txt", FILE_WRITE);
 if (myFile) {
 //collect incoming data from sensors
 //light
Serial.print("Writing to Spaziergang.txt...");
int light = analogRead(A0);
 myFile.print( "Licht: ");
 myFile.println(light);
 //temperature
 myFile.print ("Temperatur: ");
 double temp=analogRead(A1);
 double fenya=(temp/1023)*5;
 double r=(5-fenya)/fenya*4700;
 myFile.println( 1/(  log(r/10000) /3950 + 1/(25+273.15))-273.15);

 // airquality
 int gas = analogRead(A3);
 myFile.print( "Gas: ");
 myFile.println(gas, DEC);
 //pulse
 int pulse = analogRead(A2);
 myFile.print( "Pulse: ");
 myFile.println(pulse);
delay(60000); //collect data every minute
 // close the file:
 myFile.close();
 Serial.println("Sensor.geschrieben.");
 }
  else {
 // if the file didn't open, print an error:
 Serial.println("error opening Spaziergang.txt");
 }
 }
Breadboard
Rack / Helmet
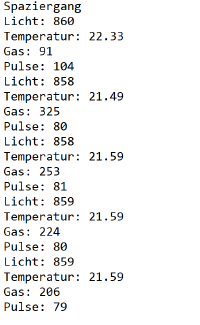
Data Arduino / SD-Card
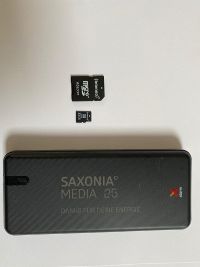
The first minute is not taken into account as the gas sensor needs about 30 seconds to be ready. In the meantime, the helmet is also put on and the route tracking is started. Delete collected data from SD-Card to seperate new from old. Copy-Paste into word sheet to make it easier to read and work with.
Data Phone
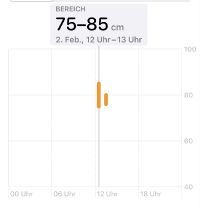
In order to track the route the app "Runkeeper" is used. To keep a steady pace a recorded metronome on Spotify is beeing played via headphones. Additionally the data for the average step-length from the "Health-App" is taken into calculation.
https://open.spotify.com/episode/23OEM2pZZi48sWNPpCKako?si=a112c55f61694699
Guide
Determinations
- Never stop walking -j ust walk in a different direction
- Always take 100 steps a minute and take care that they are the same length
- Return to startingpoint
- Don´t walk on Mondays - Corona Demonstrations
- Don´t walk in storms
- Remember that time determines size - maps are maybe not available
Sequence
Transscription Diagram
In Practice
Walking
(At the end of the video I included a clip of two police officers beeing filmed for some kind of a TV-Show. Because of this I had to stop walking and restart at another place.)
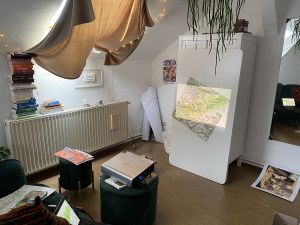
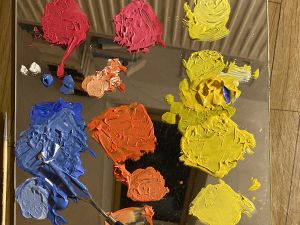
At home
Visualition
Walk 1 : Weimar City Center, 22.01.2022, 18:35, 36min, 3KM, 100 Steps a Minute
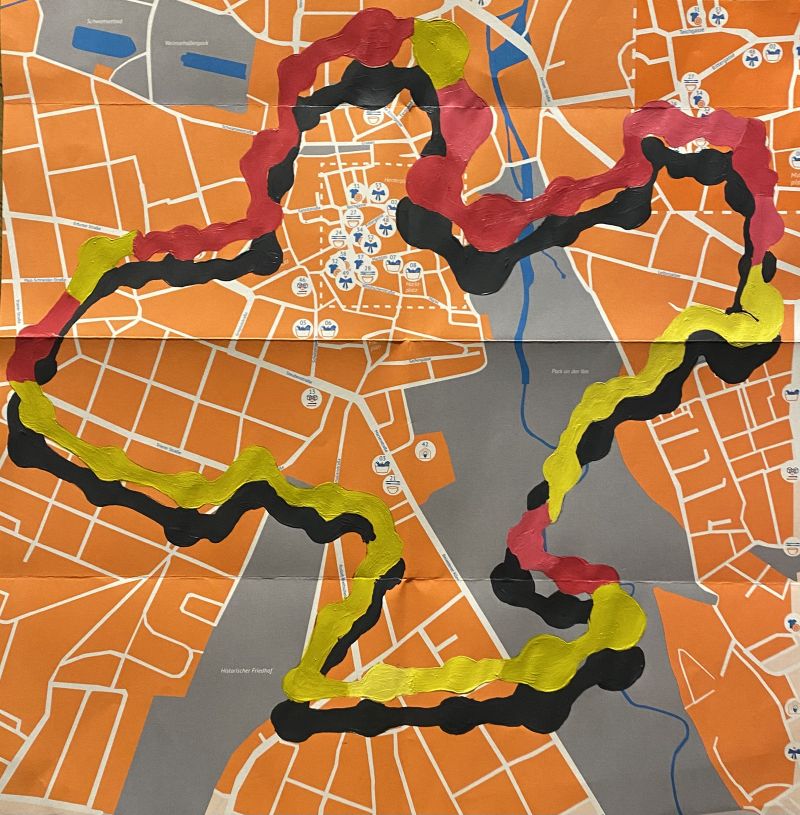
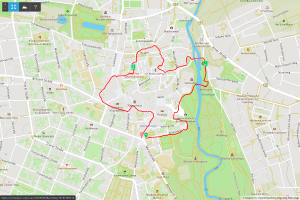 File:Spaziergang 22.01.2022 Weimar Innenstadt.pdf
Walk 2 : Weimar Ilmpark, 25.01.2022, 14:48, 57min, 4,8KM, 100Steps a Minute
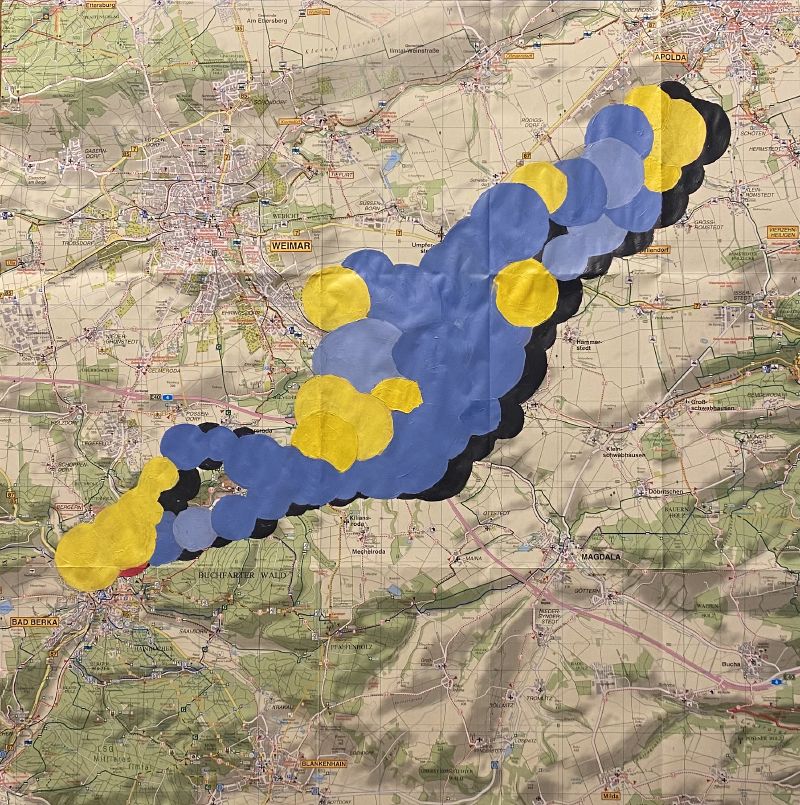
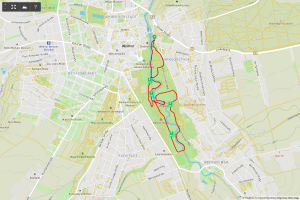 File:Spaziergang 25.01.2022 Weimar Ilmpark.pdf
Walk 3 : Weimar West, 01.02.2022,12:12, 65min, 6KM, 100 Steps a Minute
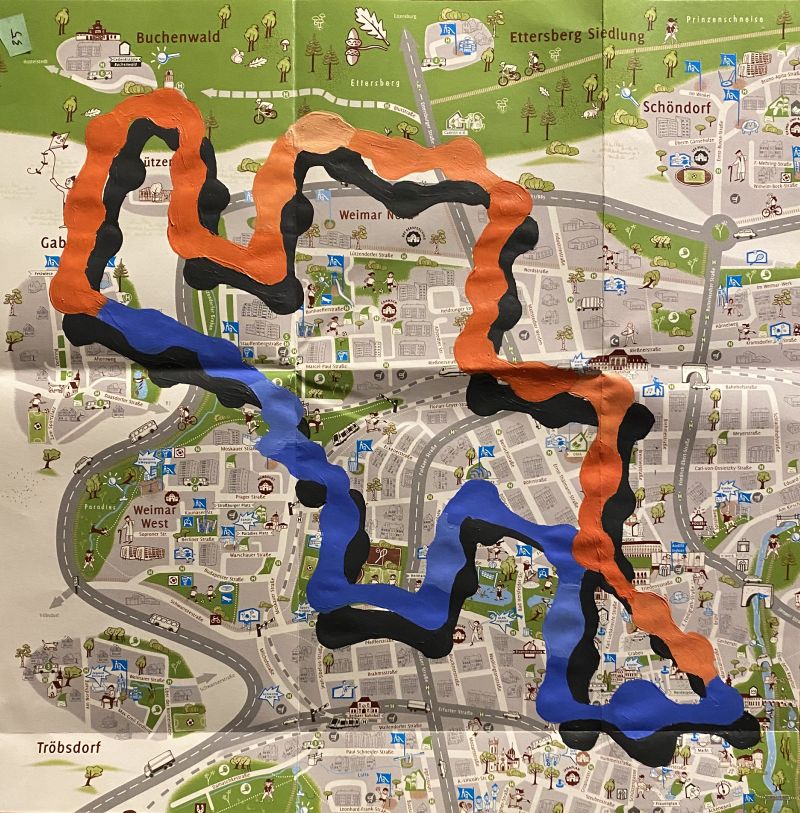
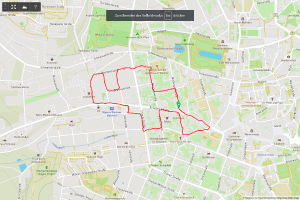 File:Spaziergang 01.02.2022 Weimar West.pdf
Walk 4 : Weimar Kirschbachtal, 17:32, 33min, 2,83KM, 100 Steps a Minute
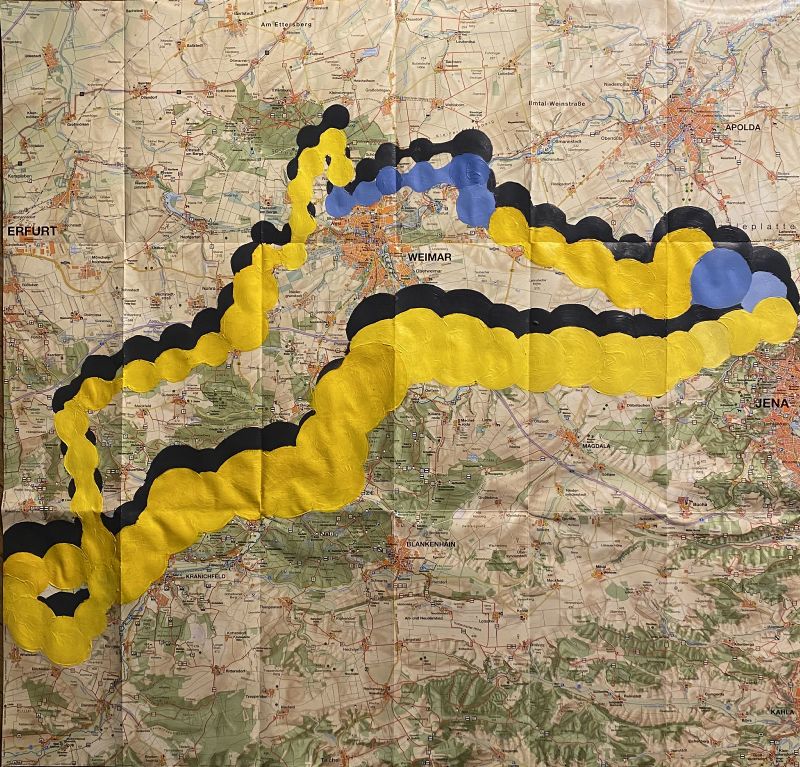
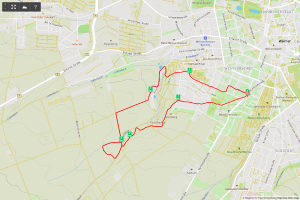 File:PDF Spaziergang 02.02.2022 Weimar Kirschbachtal.pdf
Reflecting
What I had to realise again and again in the editing time is that I am not a computer. My eye cannot determine colour as accurately as a computer and my hand is too shaky to keep perfect control over the brush. I also had to keep recalculating everything to make sure it was right. I make a lot of mistakes in editing that can't be undone.
I also had to stop many walks or couldn't make use of them because a connection didn't work properly, the weather didn't cooperate or instead of being able to continue, I suddenly found myself standing in someone's garden.
The helmet has caused quite a stir in public. Because of the conspicuousness, I was often held up and could not go for a walk peacefully, which is an essential part of a walk. People also looked at me with uncertainty (sometimes even with disgust or fear) because they couldn't judge what exactly my mission was. That's why I avoided crowded or indoor spaces.
Also, for the type of visualisation (the route line), the input of data, i.e. the change of the line, is too much. 3 sensors would have been enough. The second line seems rather confusing. The effect that space is suggested by a "shadow" is missing.
Future
I will have to get out of my comfort zone and teach myself how to deal with new media. Overcoming this and learning anew will probably be exhausting at first, but the gain is worth it. It will cost me time at first, but in the long run, it will save me a lot of time. The creative possibilities are more varied and fit better when working with precise data.
I would like to keep the concept of visualising my walks in the future. However, I would like to design the presentation digitally (Processing/Unity) and work with live data. Additionally, the background or surrounding space will be defined by sensor values, not only the route. Which sensors and which parameters I will use for the visualisation will remain flexible.
I am at odds with myself as to whether I want to keep the anit-aesthetic of the helmet or create a more inconspicuous, unprovocative design.
Thoughts while working
. Keywords/Inspiration
- Determination-Indetermination
- Thoughts by Nam June Paik
- What is the information shown in commercial maps and to what extent can they be political?
- History of Mapping-Alternative/Artistic mapping
- Strollology
- Correlation -Interpretation of Data
- Context/ Asssociation of Color
- Work of Tobias Zimmer - Identical Walk
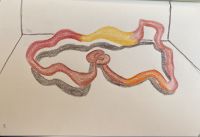
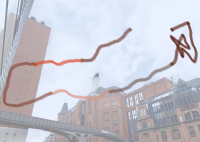
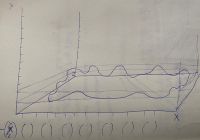
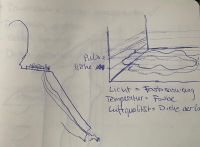
Sketches
discarded ideas
- The place and the area of the walked route are indicated. Depending on what dominates the walk, a text (internal state) or a photo (external state) is attached. Also, an attempt is made to put this state in context with the collected data
(I decided against it because the focus would be shifted away from visualising the data of the walk.)
- Photo/Gerhard Richter for background
(I decided against it because i preferred to work with the association of maps.)
- Humitdity Sensor
(I decided against it because the data input would have been to much)
- Distance Sensor
(I decided against it because the distance to surroung objects would have probably not been visible. The pulse / thickness of the line would have coverd it)
