| Line 14: | Line 14: | ||
== Workshop Pocket Science Lab (PSLab): Measurements and Robot Controls with Marco Antonio Gutierrez and Mario Behling == | == Workshop Pocket Science Lab (PSLab): Measurements and Robot Controls with Marco Antonio Gutierrez and Mario Behling == | ||
[[File:Figure_4_finger_mix.png|400px]] | |||
'''Introduction''' | '''Introduction''' | ||
| Line 44: | Line 46: | ||
changing the displayed wave type | changing the displayed wave type | ||
[[File:Figure_15.png|400px]] [[File:Figure_18.png|400px]] [[File:Figure_21.png|400px]] | [[File:Figure_15.png|400px]] | ||
[[File:Figure_18.png|400px]] | |||
[[File:Figure_21.png|400px]] | |||
[[File:Figure_3_finger.png|400px]] | |||
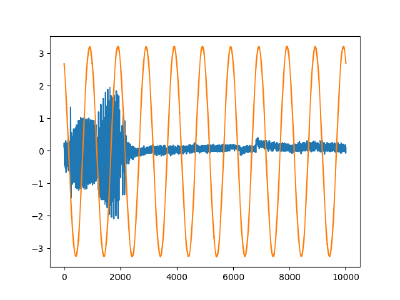
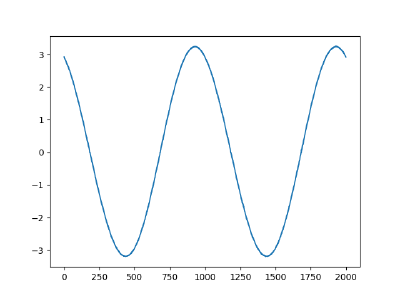
comparing the results to a living organism - ourselves- and displaying the electrical voltages in our fingers. | |||
Revision as of 22:25, 11 February 2023
Workshop on biofilms with Katja Bühler
Workshop Pocket Science Lab (PSLab): Measurements and Robot Controls with Marco Antonio Gutierrez and Mario Behling
Introduction
During this workshop in January, we learned about the PSLab - Pocket Science Lab -, which is an open-source project. A small hardware extension board enables the collection of measurements and data with the phone or PC through different sensors.
PSLab can function as a:
Oscilloscope I Multimeter I Logic Analyzer I Wave Generator I Power Source I Accelerometer I Barometer I Compass I Luxmeter I ...
Sensor experiments
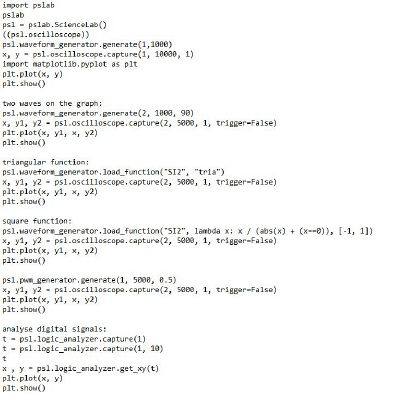
After learning about the functions and possibilities we started experimenting by connecting the PSLab sensors to the PC and giving commands in Python.
We were using the board as an oscilloscope to graphically display varying electrical voltages. For that, we connected two points on the device and changed the script to generate waves with different characteristics.
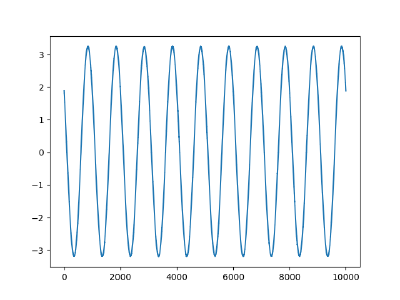
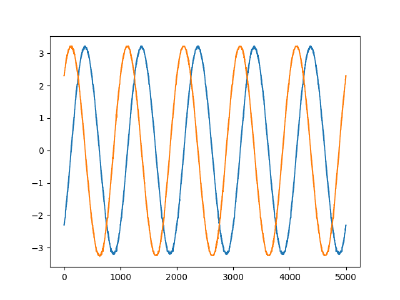
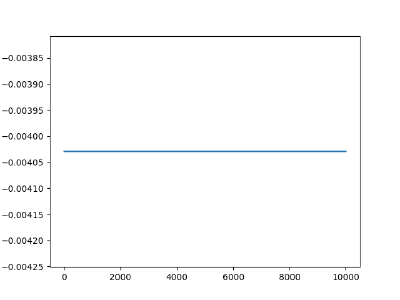 first setting: the waves are not visible, the spectrum needs to be adjusted
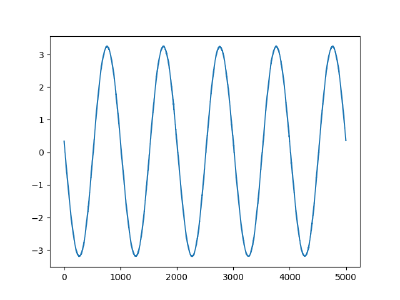
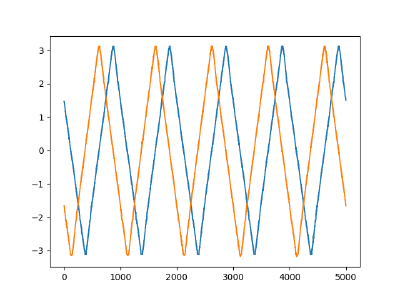
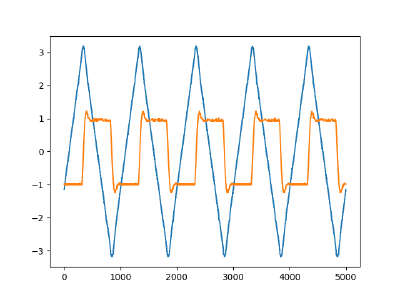
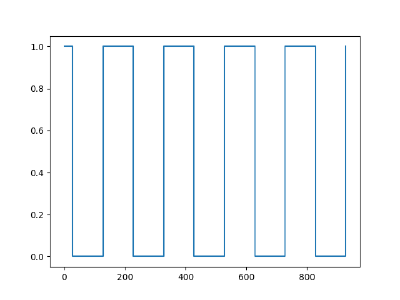
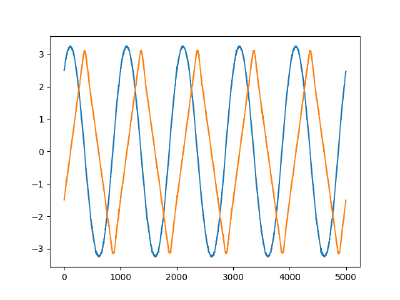 changing the displayed wave type
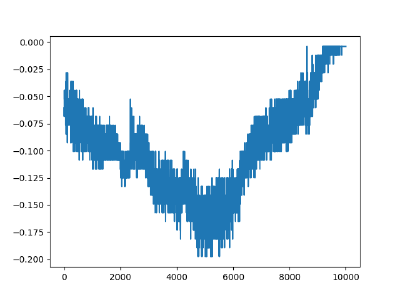 comparing the results to a living organism - ourselves- and displaying the electrical voltages in our fingers.
conclusion
