| Line 34: | Line 34: | ||
<gallery> | <gallery> | ||
File:IMG_0804.JPG|circuit_1 | File:IMG_0804.JPG|circuit_1 | ||
File:IMG_0805.JPG|circuit_2 | File:IMG_0805.JPG|circuit_2 | ||
File:IMG_0807.JPG|circuit_3 | File:IMG_0807.JPG|circuit_3 | ||
File:IMG_0812.JPG|circuit_4 | File:IMG_0812.JPG|circuit_4 | ||
File:IRDetector-0.jpg|IR-Emitter/Detector | File:IRDetector-0.jpg|IR-Emitter/Detector | ||
File:basicirdetectemit.gif|circuit_schematic | File:basicirdetectemit.gif|circuit_schematic | ||
| Line 59: | Line 59: | ||
<br> | <br> | ||
<gallery> | <gallery> | ||
File:IMG_0821.JPG|circuit with amplifier | File:IMG_0821.JPG|circuit with amplifier | ||
File:IMG_0822.JPG|circuit with amplifier | File:IMG_0822.JPG|circuit with amplifier | ||
File:amplifier.png|circuit schematic | File:amplifier.png|circuit schematic | ||
File:processing_heartrate_4.jpg|processing screenshot | File:processing_heartrate_4.jpg|processing screenshot | ||
File:IMG_0827.JPG|Arduino with Data Logger Shield | File:IMG_0827.JPG|Arduino with Data Logger Shield | ||
File:IMG_0826.JPG|Arduino with Data Logger Shield | File:IMG_0826.JPG|Arduino with Data Logger Shield | ||
</gallery> | </gallery> | ||
<br> | <br> | ||
| Line 70: | Line 70: | ||
<br> | <br> | ||
<gallery> | <gallery> | ||
File:IMG_0828.JPG|EKG Sensor | File:IMG_0828.JPG|EKG Sensor | ||
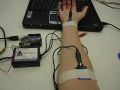
File:IMG_0830.JPG|EKG Sensor with Arduino board | File:IMG_0830.JPG|EKG Sensor with Arduino board | ||
File:IMG_0831.JPG|electrode patches with alligator clips | File:IMG_0831.JPG|electrode patches with alligator clips | ||
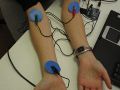
File:IMG_0835.JPG|three electrode patches placed on arms | File:IMG_0835.JPG|three electrode patches placed on arms | ||
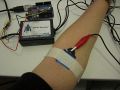
File:IMG_0837.JPG|positive electrode on left elbow | File:IMG_0837.JPG|positive electrode on left elbow | ||
File:IMG_0838.JPG|negative reference electrode on right arm | File:IMG_0838.JPG|negative reference electrode on right arm | ||
File:ekg_sensor.jpg|heartbeat on processing window | File:ekg_sensor.jpg|heartbeat on processing window | ||
File:ekg_sensor_calm.jpg|heartbeat calm | File:ekg_sensor_calm.jpg|heartbeat calm | ||
File:ekg_sensor_increased.jpg|heartbeat increased | File:ekg_sensor_increased.jpg|heartbeat increased | ||
File:ekg_sensor_processing_screen.jpg|heartbeat on processing window | File:ekg_sensor_processing_screen.jpg|heartbeat on processing window | ||
</gallery> | |||
<br> | |||
<br> | |||
<gallery> | |||
File:brustgurt.jpg| chest strap | |||
File:IMG_0853.JPG|chest strap and data-logger | |||
File:IMG_0855.JPG|data-logger | |||
File:IMG_0856.JPG|data-logger | |||
File:oregon-data-logger_2.jpg|interface data-logger program | |||
File:oregon-data-logger_2_markiert.jpg|interface data-logger program | |||
File:oregon-data-logger_3.jpg|interface data-logger program | |||
</gallery> | |||
<br> | |||
<br> | |||
<gallery> | |||
File:diagram_heartrate_1.jpg|possible interface design | |||
File:diagram_heartrate_2.jpg|possible interface design | |||
File:diagram_heartrate_3.jpg|possible interface design | |||
File:diagram_heartrate_4.jpg|possible interface design | |||
File:diagram_heartrate_5.jpg|possible interface design | |||
File:diagram_heartrate_6.jpg|possible interface design | |||
File:diagram_heartrate_7.jpg|possible interface design | |||
File:maps-heartrate.jpg|different possible interface design | |||
</gallery> | </gallery> | ||
<br> | <br> | ||
Revision as of 20:49, 2 February 2012
EHP - Emotion Heartbeat Project
The "Emotion Heartbeat Project" is a project that will collect my heartrate as a datatype. This data will be displayed in a visual way with diagrams and create an emotional diary out of that. With an increased heartrate the heartrate monitor will ask for the cause of it to differentiate between positive and negative stress or sports activities.
First Ideas And Thoughts

EHP

Emotion Diary
Headphones
Heartrate Monitor
Decision Diagram
Manual Measurement
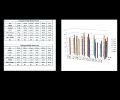
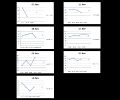
Collected Heartbeat-Data Within 1 Week
Heartrate Diagrams


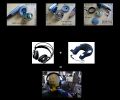
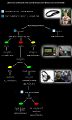
One of my first ideas was to connect the heartrate monitor with headphones that would calm down my increased heartrate with music and vibrating sensors at my neck; showing picture 3 and 5. The decision diagram displays how this should work.
But within this semester I will just build up the heartrate monitor itself.
Picture 6 and 7 are showing the result of 1 week of collecting heartrate data. I counted my heartbeat within 1 minute manually 4 times a day for 1 week. Pic 6 shows a diagram displaying the whole week at a glance; Pic 7 shows the diagrams of each day in particular. (Unfortunately I couldn't get it work with a consistent scale for the heartrate.)
Related Links To That Topic
- http://www.eng.utah.edu/~jnguyen/ecg/instructions.html
- http://www.swharden.com/blog/2009-08-14-diy-ecg-machine-on-the-cheap/
- http://infosthetics.com/archives/2006/07/beating_heart_blog.html
- http://netzspannung.org/cat/servlet/CatServlet/$files/320590/herzfassen-technik.pdf
How To Build It?
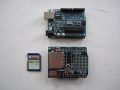
circuit_1
circuit_2
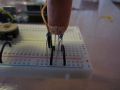
circuit_3
circuit_4
IR-Emitter/Detector
circuit_schematic
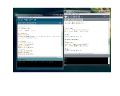
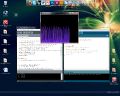
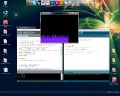
arduino_processing

processing_screen


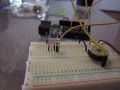
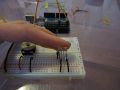
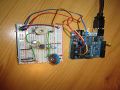
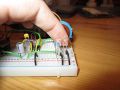
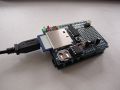
Inspired by diverse links and Youtube videos the very first try to build it was to use IR Emitter and Detector. It didn't work that well: the sensors are pretty sensitive for moving action and the signal at processing was very faint.
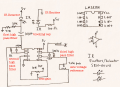
To amplify the signal I used a low voltage op-amp LM358N.
The images of the third gallery show the circuit, schematic and processing screen result.
Related Links
- http://www.youtube.com/watch?v=BAp1snPchT4&NR=1
- http://www.youtube.com/watch?v=yADsi5W-Lls
- http://www.andere-baustelle.net/?page_id=101
- http://suchamagicworld.blogspot.com/2008/04/still-alive-heartbeat-irsensor-report.html
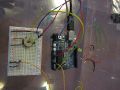
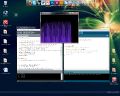
The Data Logger Shield for the Arduino board is directly plugged on the top of it and will save the collected data to a SD card.
circuit with amplifier
circuit with amplifier
circuit schematic

processing screenshot
Arduino with Data Logger Shield
Arduino with Data Logger Shield


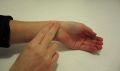
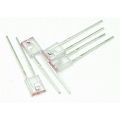
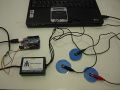
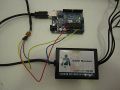
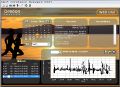
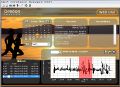
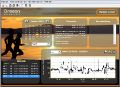
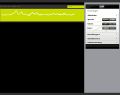
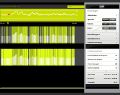
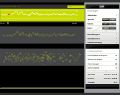
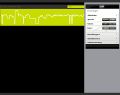
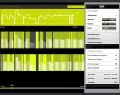
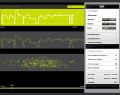
The selfmade sensor with the IR Emitter and Detector is very sensitive for any motion and movements of the finger being measured. So I tried out a EKG Sensor which displayed a higher resolution of the heartbeat on processing. There are 3 electrodes patches placed on the skin: One on the right wrist for the reference, one on right elbow for the negative alligator clip and one on the left elbow for the positive clip. The EKG Sensor is connected with the Arduino to Ground, 5V and Analog Input A0. The heartbeat is displayed with Processing.
EKG Sensor
EKG Sensor with Arduino board
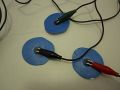
electrode patches with alligator clips
three electrode patches placed on arms
positive electrode on left elbow
negative reference electrode on right arm
heartbeat on processing window
heartbeat calm
heartbeat increased
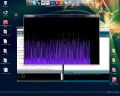
heartbeat on processing window


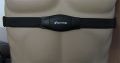
chest strap
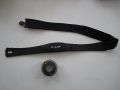
chest strap and data-logger
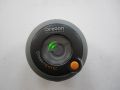
data-logger
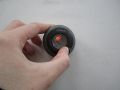
data-logger
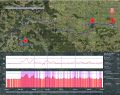
interface data-logger program
interface data-logger program
interface data-logger program


possible interface design

possible interface design
possible interface design
possible interface design
possible interface design
possible interface design
possible interface design
different possible interface design


