GMU:Speculative Atmospheres II/Friedrich Wilhelm Albrecht Pittelkow: Difference between revisions
mNo edit summary |
|||
| Line 1: | Line 1: | ||
== Generative images influenced by tempererature == | == Generative images influenced by tempererature == | ||
[[File: | [[File:Scrn_2.jpg]] | ||
=== Idea === | === Idea === | ||
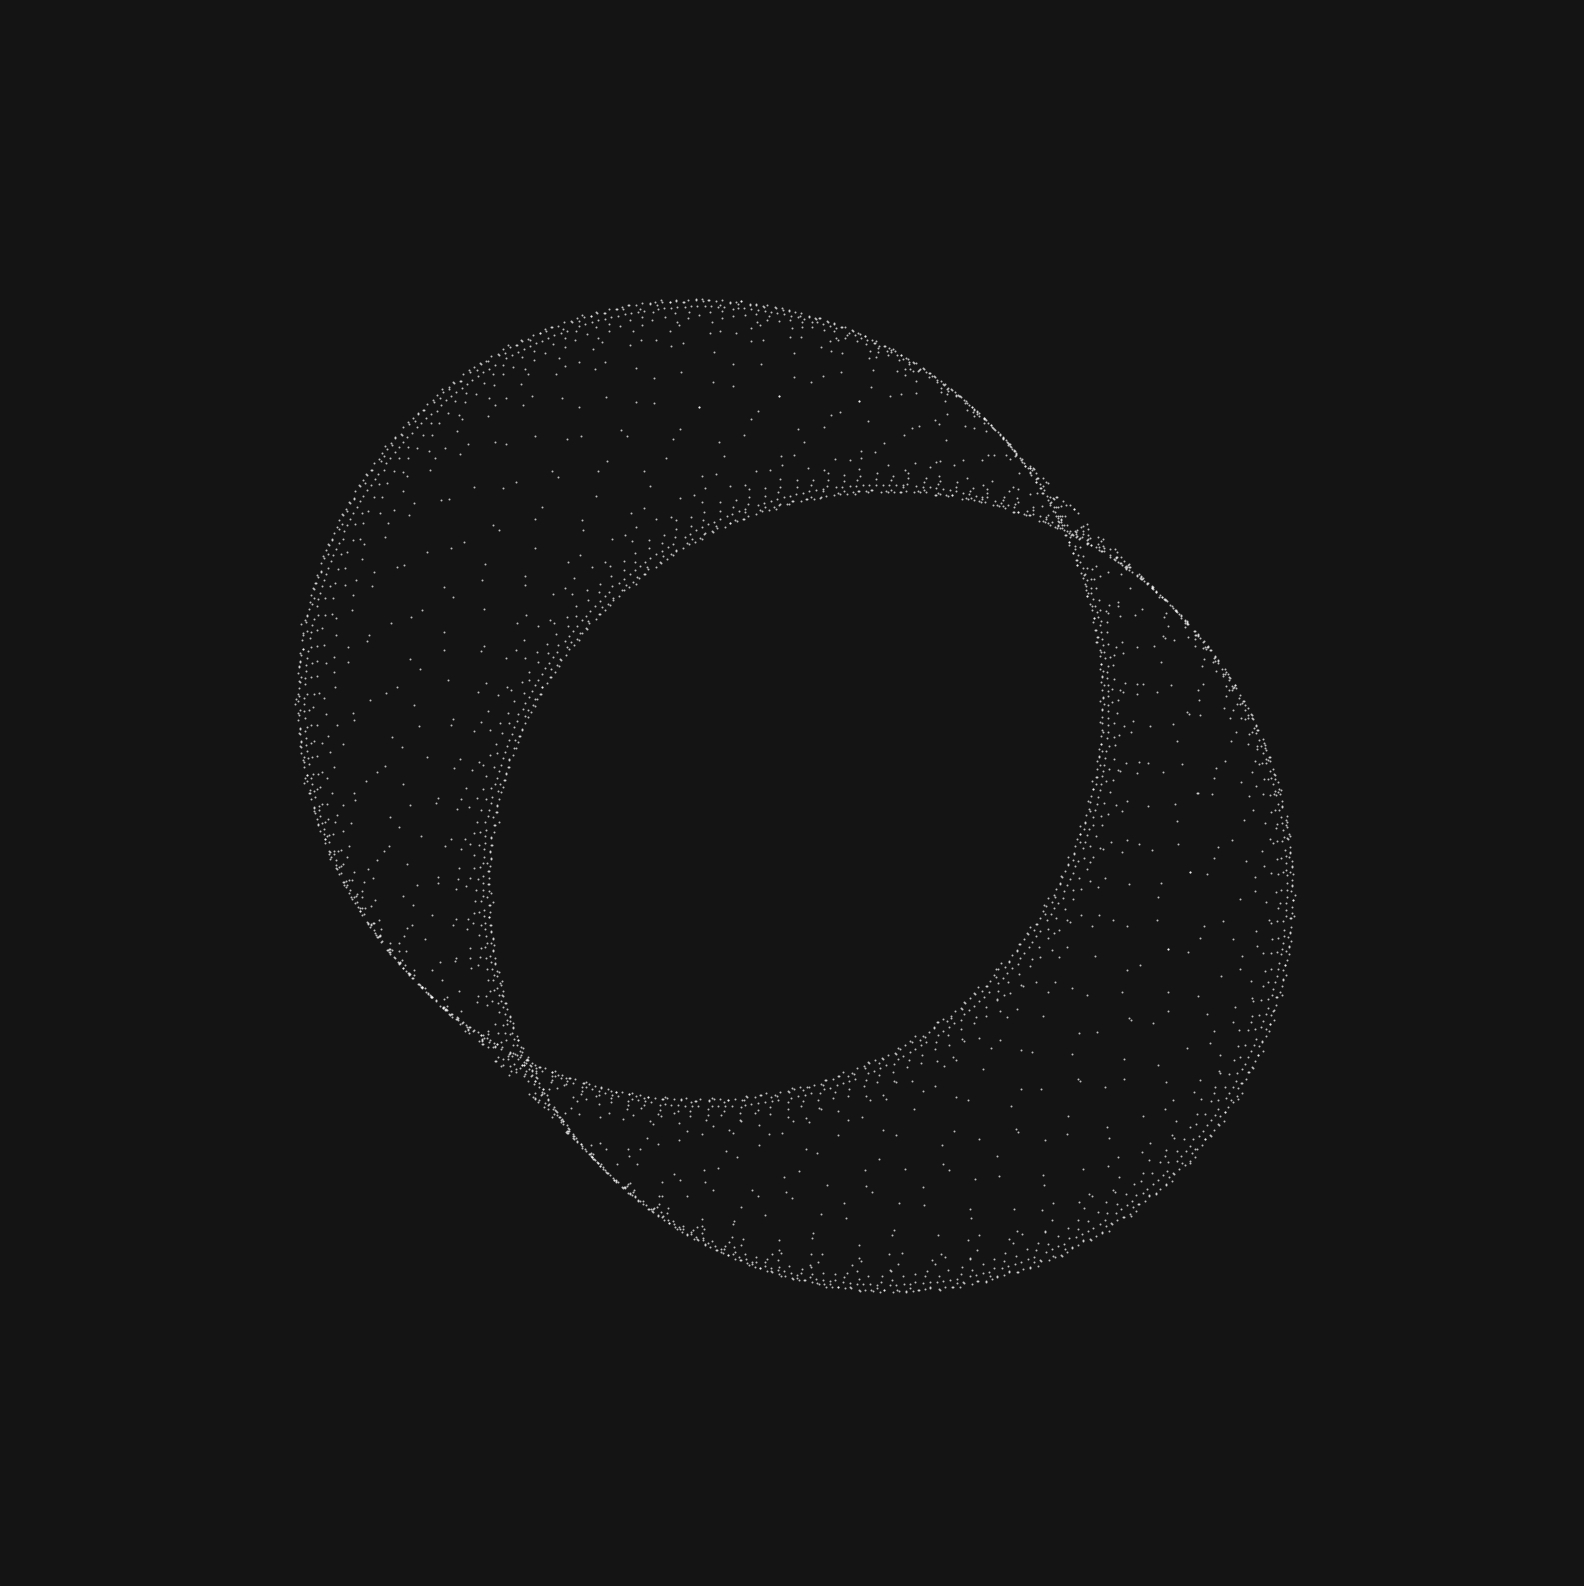
A genarative image | A genarative image is drawn and influenced by the data of a temperature sensor. The data is used as an offset when generating the images. | ||
The goal is to explore the visualisation data and patterns inside the data in a new way. It's not a scientific visualisation - like a bar graph - more it should be a tool to help understanding the general concept of a data set while being visually appealing. | |||
Maybe it is possible for the viewer to connect own ideas, concepts while viewing the visualisation and find a own interpretation and connection to the environment. | |||
=== Examples / Current state === | |||
<gallery> | |||
File:DATA.TXT_1_b.jpg | |||
File:DATA.TXT_1.jpg | |||
File:Data1_1.jpg | |||
File:Data2_1.jpg | |||
</gallery> | |||
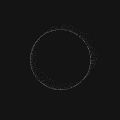
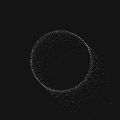
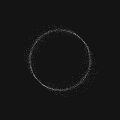
Each drawn point correlates to a point in the data-set. The eqaution used to generate images would describe a circle. The data pushes the points off the point away from this path in relation to their values. | |||
=== The Toolkit === | |||
The toolkit provides everything to collect data in the field. In the weather sealed case the Arduino-board with an attached sensor as well as a battery to provide power and a SD card for storrage. | |||
The case protects the arduino and circuit from the environment. | |||
<gallery> | |||
File:fp01.jpeg | |||
File:fp02.jpeg | |||
</gallery> | |||
=== Processing === | |||
In Processing the data-file from the Tool-Kit gets spilt up line by line and stored in an array. Since we can easily analyze an array in processing we can find the lowes and highest point in the data to create a adequate range range to apply it. | |||
Also we find the total ammount of points to determine when to stop plotting them and exporting the image. | |||
=== | <nowiki> dataArray = float(loadStrings(dataFile)); | ||
tMax = dataArray.length; | |||
nMin = min(dataArray); | |||
nMax = max(dataArray); | |||
</nowiki> | |||
To draw the image a simple equation is used: | |||
<nowiki>float x1(float t, float offset) { | |||
* | return cos(t / calcConst) * 200 + cos(t / calcConst) - offset * 2; | ||
} | |||
* | float y1(float t, float offset) { | ||
return sin(t / calcConst) * 200 + cos(t / calcConst) - offset * 2; | |||
}</nowiki> | |||
Inside the functions you will find the offset - which gets set by the data - and a calcConstant. By modifing this new varieties of patterns can be genarated. | |||
Latest revision as of 00:43, 9 February 2022
Generative images influenced by tempererature
Idea
A genarative image is drawn and influenced by the data of a temperature sensor. The data is used as an offset when generating the images. The goal is to explore the visualisation data and patterns inside the data in a new way. It's not a scientific visualisation - like a bar graph - more it should be a tool to help understanding the general concept of a data set while being visually appealing.
Maybe it is possible for the viewer to connect own ideas, concepts while viewing the visualisation and find a own interpretation and connection to the environment.
Examples / Current state
Each drawn point correlates to a point in the data-set. The eqaution used to generate images would describe a circle. The data pushes the points off the point away from this path in relation to their values.
The Toolkit
The toolkit provides everything to collect data in the field. In the weather sealed case the Arduino-board with an attached sensor as well as a battery to provide power and a SD card for storrage. The case protects the arduino and circuit from the environment.
Processing
In Processing the data-file from the Tool-Kit gets spilt up line by line and stored in an array. Since we can easily analyze an array in processing we can find the lowes and highest point in the data to create a adequate range range to apply it. Also we find the total ammount of points to determine when to stop plotting them and exporting the image.
  dataArray = float(loadStrings(dataFile));
  tMax = dataArray.length;
  nMin = min(dataArray);
  nMax = max(dataArray);
To draw the image a simple equation is used:
float x1(float t, float offset) {
  return cos(t / calcConst) * 200 + cos(t / calcConst) - offset * 2;
}
float y1(float t, float offset) {
  return sin(t / calcConst) * 200 + cos(t / calcConst) - offset * 2;
}
Inside the functions you will find the offset - which gets set by the data - and a calcConstant. By modifing this new varieties of patterns can be genarated.
