28/10
Homework
Check the links below. Choose one or two projects, works you really like and write a short text about it. (why you like it, what is interesting for you and what happens there. Feel free to look at other sources as well. We'll have a look at them tomorrow.
http://processing.org/exhibition/
http://www.openprocessing.org/
http://vimeo.com/groups/processing
http://www.visualcomplexity.com/vc/
http://www.creativeapplications.net
http://www.complexification.net
Patawat Phamuad
project:
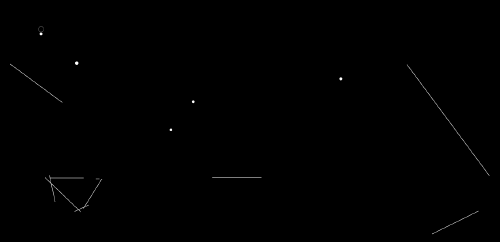
Balldroppings

click at above picture to go to application.
description:
This web-based application is constructed from Processing.js, a part of Processing language which is able to run on browser. The most interesting point of this project is to focus on both 2 of 4 approaches to interactive design.
For the first approach "User-Centered Design" , the designer tried to make a simple drum without any complicated set of drum pieces. Only lines and circles working with physic law are able to initiate a set of user-based instrument. Importantly, the user foresees what is supposed to be happened without any instructions.
Furthermore, the second approach focuses on "Activity-Center Design" . The system flows until the user press "close" button on web browser. The system has no fixed ending. Thus, the designer designed tool for actions. In addition, each action directly depends on each own person's experience and mental processes. (Exteriorized:-interesting in what people do)
system & technology:
I.application processes active to each order <balls & lines>
II.Users active to application process. <dragging line & outputsound>
III. Processing.js + html5
referred:
Dan S. Designing for interaction. The four approaches to interaction design. (2001)
Processing.js, iProcessing: javascript does everything for you!
Sebastian – everyware, Soak
<videoflash type=vimeo>27158491|549|309</videoflash>
Soak is an empty canvas made of an elastic material. The moment you touch it the canvas gets virtually soaked with color.
A Kinect detects any deformation of the elastic surface and passes this data to Processing, which then simulates virtual drops of dye.
What I like about this project is the combination of digital tools with analog materials and the beauty of being so simple. The simulation of watercolor on the other hand is very interesting as well. (*cellular automata)
Substrate
by Jared Tarbell [1]

0001 iterated substrate by Jared Tarbell [2]
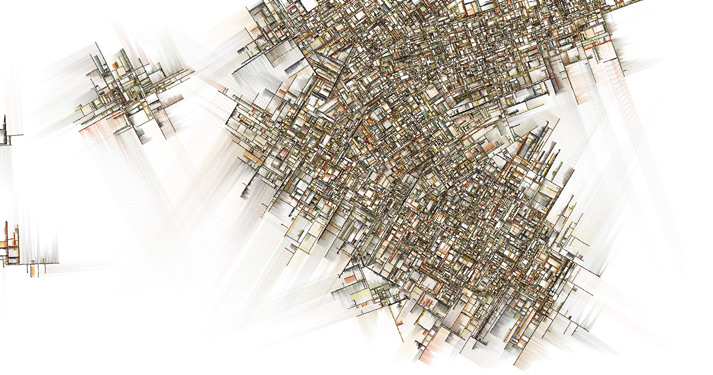
Substrate is a piece of generative art written in processing that creates a landscape looking a lot like urban plans.
At the start of the program a couple of straight black lines are placed randomly on the canvas. They expand during the program, each line growing other lines at right angle but at random positions and at random times. This process is repeated for the newly grown lines. The expansion of a line stops when it collides with another line.
Each line has a shadowish colouring of variable hue and amplitude to the left of the line's growing direction.
Due to the different angles of the starting lines the growing image consists of distinguishable parts that could resemble city districts if the image was compared to an urban plan.
Substrate seems particularly interesting as it creates beautiful patterns using a rather simple algorithm.
(md)
Alexander Gustke
OASIS

http://everyware.kr/portfolio/contents/09_oasis/
Was ist OASIS?
In OASIS hat der Benutzer die Möglichkeit mit einer virtuellen Unterwasserwelt mit allen möglichen Tieren die dort leben zu interagieren.
Basis ist ein Touchscreen der vollständig mit schwarzem Sand bedeckt ist. Wenn der Sand zur Seite geschoben wird und freie Stelle entstehen, bildet sich in diesen eine kleine Welt voller Fische, Seesterne und Quallen. Durch das Wegschieben des Sandes entsteht eine erweiterte Welt in der sich dann mehr Fische und andere Tiere bilden können. Das Verkleinern der Welt führt dazu, dass sich alle Tiere den engeren Platz teilen müssen. Weiterhin reagiert die Welt auf Hindernisse, wie zum Beispiel Steine. Diese können inmitten einer freien Stelle platziert werden, welche die Unterwassertiere dann versuchen zu umschwimmen.
Was mich zu den oben genannten Dingen zusätzlich interessiert ist, dass Fische Schwärme bilden können und versuchen innerhalb des Schwarms nicht miteinander zu kollidieren.
Julia Putscher
Project:
Algorithm Art Code

click at above picture to go to application.
Description:
This project was made by Joao Martinho Moura with Processing.js.
Processing.js is the sister project of Processing and designed for the web. It makes makes your data visualizations, digital art, interactive animations, educational graphs, video games, etc. work using web standards and without any plug-ins. Processing.js allows Processing code to be run by any HTML5 compatible browser, including current versions of Firefox, Safari, Chrome, Opera, and Internet Explorer.
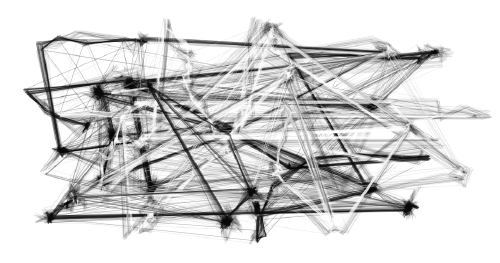
Algorithm Art Code is a generative system that creates compositions of lines and even sculptures. It is able to cause multiple results and may even produce art. By clicking into the interactive frame and moving the mouse you can influence the appearence of the creating composition. There are six different types of the "Algorithm Art Code": TR-Lines (Transversal Lines), Closed Lines, Infinite-Boils, Perls and Sine-Paths. I think this project is interesting because I like interactive surfaces that "act" according to a human's behavior and through which you can influence the result of the process.
Links:
- http://www.jmartinho.net / Webpage of Joao Martinho Moura
- http://projects.jmartinho.net/#1577272/Html5-Algorithm-Art-Code / Examples for Algorithm Art Code
Dianna Mertz
 New York Talk Exchange
Globe Encounters
This animated infographic illustrates the flow of information in real time between I.P. addresses in New York City and elsewhere around the world. The greater the illumination of each arc, the greater the internet traffic flow between NYC and that particular city within the last day. This project appeals to me mostly because it successfully demonstrates information consumption — a personal area of interest. This is also a great way to relay the usage of I.P. address data. I only wish that it wasn't limited to NYC; ideally, we'd see how the info traffic consumption flowing from NYC compares to other cities around the world.
Jelena Djokic

http://xiaoji-chen.com/blog/2010/map-of-paris-visualizing-urban-transportation/
The work is a mental map of the city of Paris, not related to the proportional distancies of diferent points to the city center, but to the cost it takes to get there.
http://vimeo.com/groups/processing/videos/30735367/ Interactive DJing tool