Idea
Mapping of the Invisible Enviorment
For my project I want to collect the invisible elements (data) that shape the natural atmosphere on my walks and visualize them artistically.
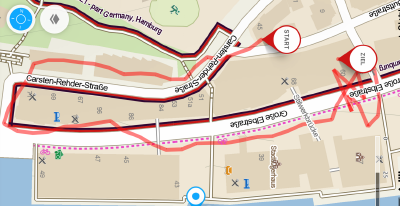
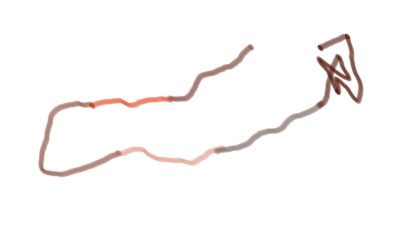
On the route, light, air quality, temperature and pulse are measured every minute using an Arduino and sensors. These are stored via an SD card and read out with a code. The time and route are stored using a tracking app.The data determines the parameters of the subsequent image design. For transport, a "rack" is built that attaches the breadboard to the body.
- include <SPI.h> //including SDcard
 #include <SD.h>
 #include <math.h> //including for temperature calculation
File myFile; //directing data to file
void setup() { Serial.begin(9600); //starting comunication with arduino while (!Serial) {
}
Serial.print("Initializing SD card..."); //initializing the SD card
 if (!SD.begin(10)) {
 Serial.println("initialization failed!"); // signal if connection failed
while (1); }
 Serial.println("initialization done."); // signal if connection succeded
 myFile = SD.open("test.txt", FILE_WRITE); //naming file
 if (myFile) {
 Serial.print("Writing to test.txt...");
 myFile.println ("Spaziergang"); //naming the section of the file, date, place, number of walk
 myFile.close();
 Serial.println("done.");
} else { // if the file didn't open, print an error:
  Serial.println("error opening test.txt"); //signal if opening failed
 }
}
void loop() {
//if the communication started successfully-
 myFile = SD.open("test.txt", FILE_WRITE);
 if (myFile) {
//collect incoming data from sensors //light
Serial.print("Writing to test.txt...");
int light = analogRead(A0);
 myFile.print( "Licht: ");
 myFile.println(light);
//temperature
 myFile.print ("Temperatur: ");
 double temp=analogRead(A1);
 double fenya=(temp/1023)*5;
 double r=(5-fenya)/fenya*4700;
 myFile.println( 1/(  log(r/10000) /3950 + 1/(25+273.15))-273.15);
 // airquality
 int gas = analogRead(A3);
 myFile.print( "Gas: ");
 myFile.println(gas, DEC);
//pulse
 int pulse = analogRead(A2);
 myFile.print( "Pulse: ");
 myFile.println(pulse);
delay(60000); //collect data every minute // close the file:
 myFile.close();
 Serial.println("Sensor.geschrieben.");
}
else {
// if the file didn't open, print an error:
Serial.println("error opening test.txt");
} }
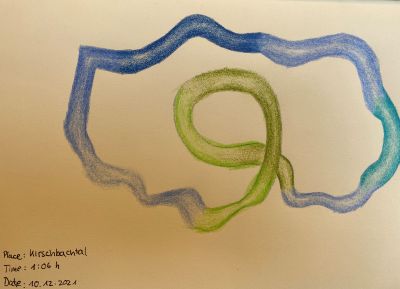
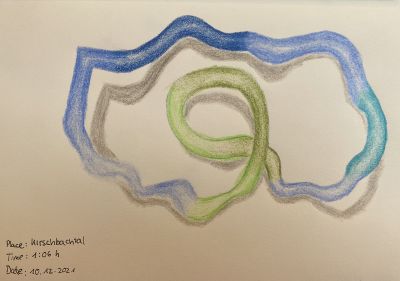
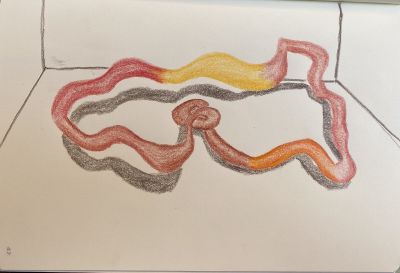
After each walk the collected Data will be read out and acryl painted onto a cardboardcanvas.
- Time/Duration= Size of the canvas
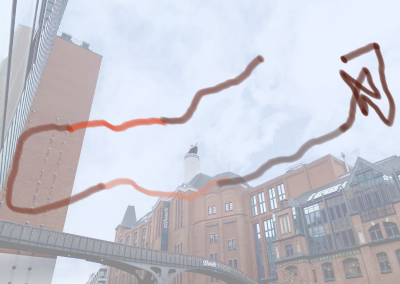
- Route= Shape of the line
- Temperature= Color
- Light= Saturation of the color
- Air quality= contour of the line
- Pulse= Height of the line
- Humidity= Thickness of the line
- (distance= space around the line)
- (Background= Photograph of the Walk)
Additional
The place and the area of the walked route are indicated. Depending on what dominates the walk, a text (internal state) or a photo (external state) is attached. Also, an attempt is made to put this state in context with the collected data.
Keywords
- Determination-Indetermination
- History of Mapping
- Strollology
- Correlation of Data
- Context/ Asssociation of Color
- (Gerhard Richter)
